ANOVA
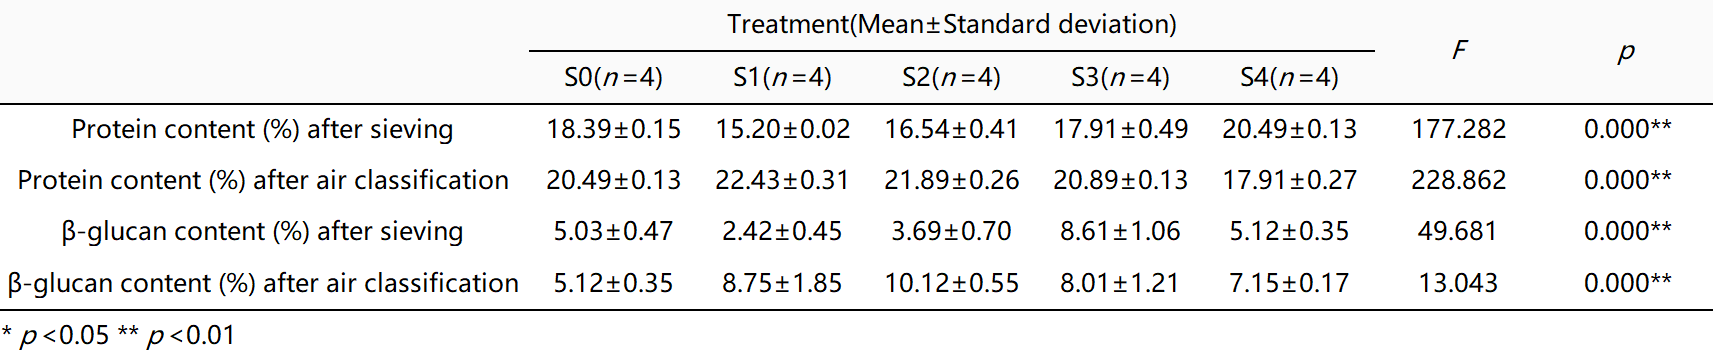
Table 2. ANOVA of protein and β-glucan content (%) of different fractions of the normal oat flour.
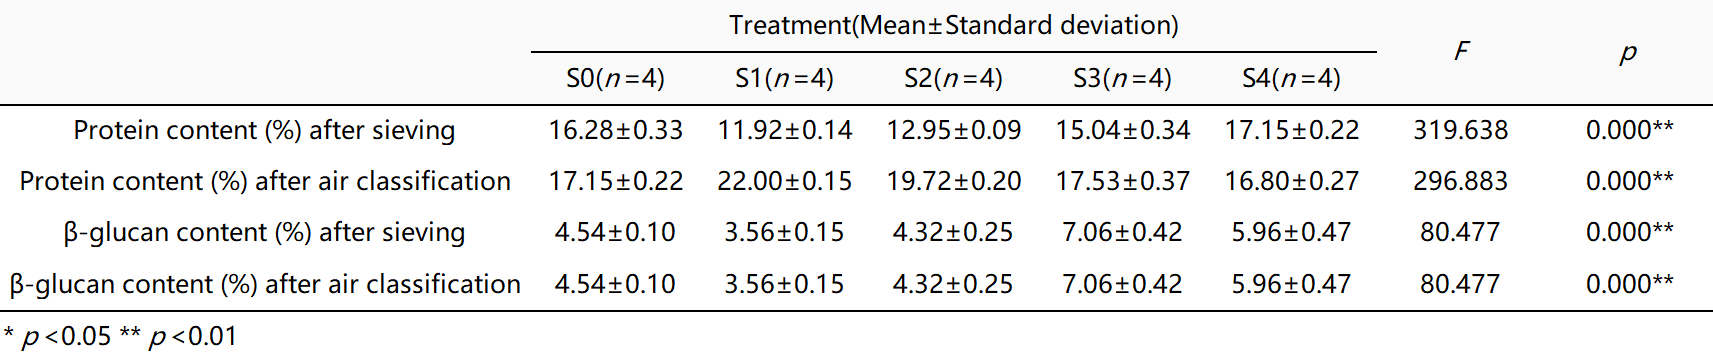
Table 3. ANOVA of protein and β-glucan content (%) of different fractions of the gluten-free oat flour.
|
S0: original oat flour
S1: Fraction whose size is 53~75 μm S2:size: Fraction whose size is 75~125 μm S3:size: Fraction whose size is 125~250 μm S4:size: Fraction whose size is 250 μm and over |
A0: S4
A1: Fraction which used a 2500 rpm speed of air classification A2: Fraction which used a 3500 rpm speed of air classification A3: Fraction which used a 4500 rpm speed of air classification A4: Fraction which used a 5500 rpm speed of air classification |
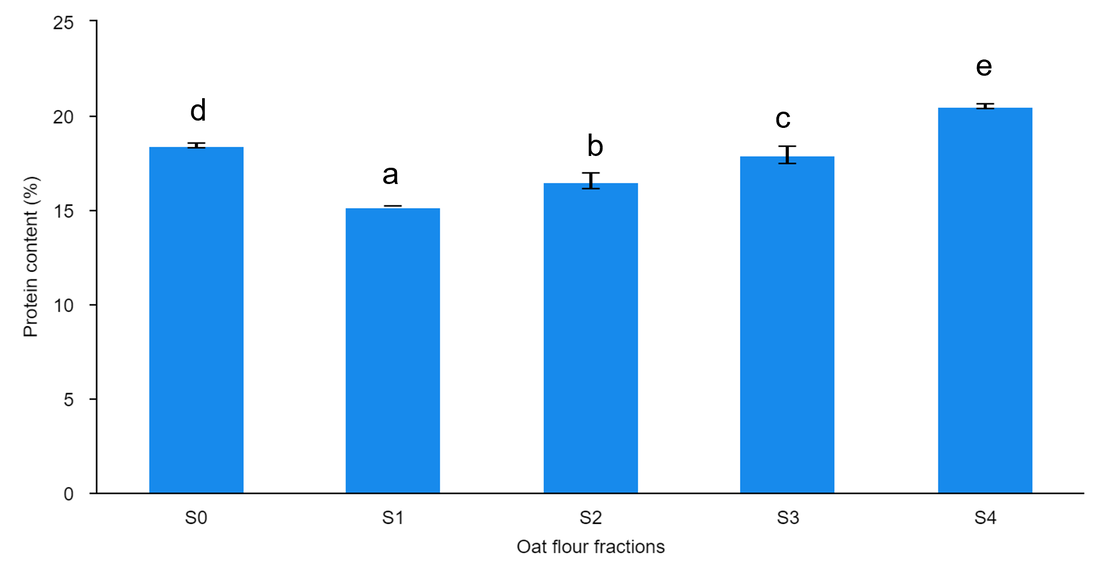
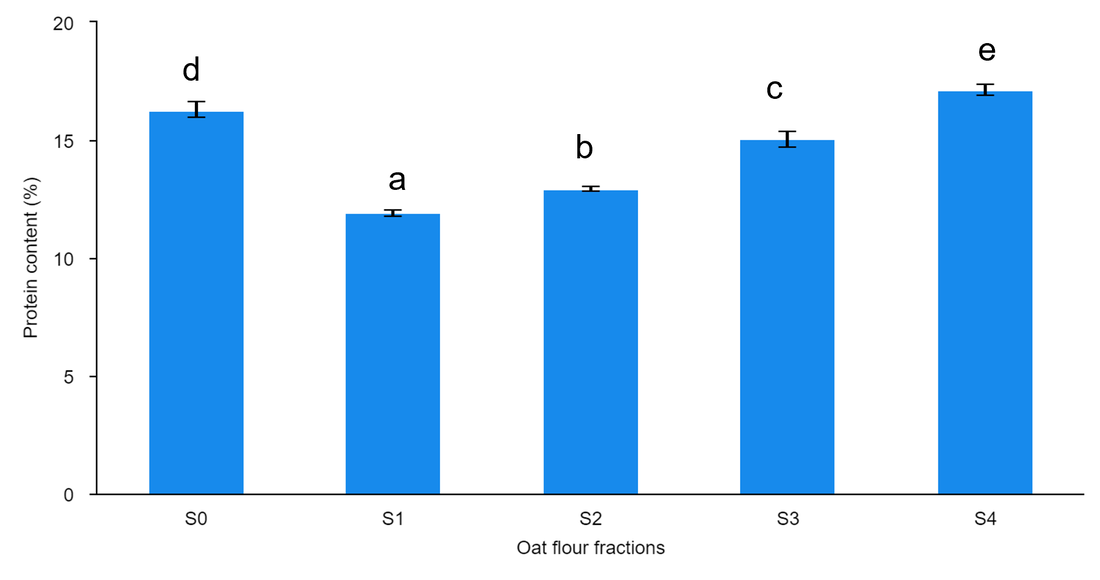
Graph 5. Bar chart of protein content (%) of different normal oat flour sieving fractions. Lower case letters indicate significant differences among treatments. Treatments with the same letter are not significantly different at α = 0.05.
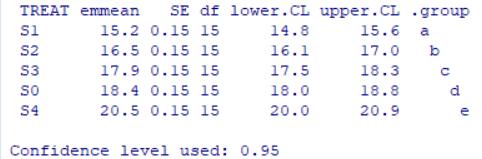
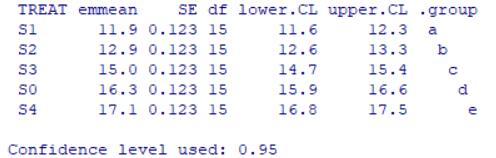
Graph 7. ANOVA on protein content (%) of different normal oat flour sieving fractions.
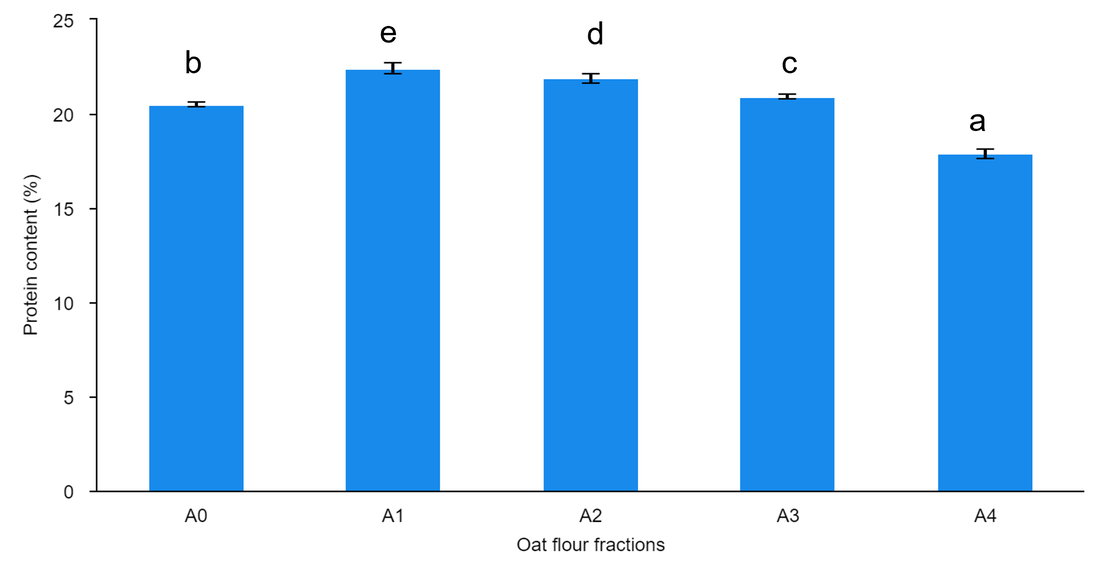
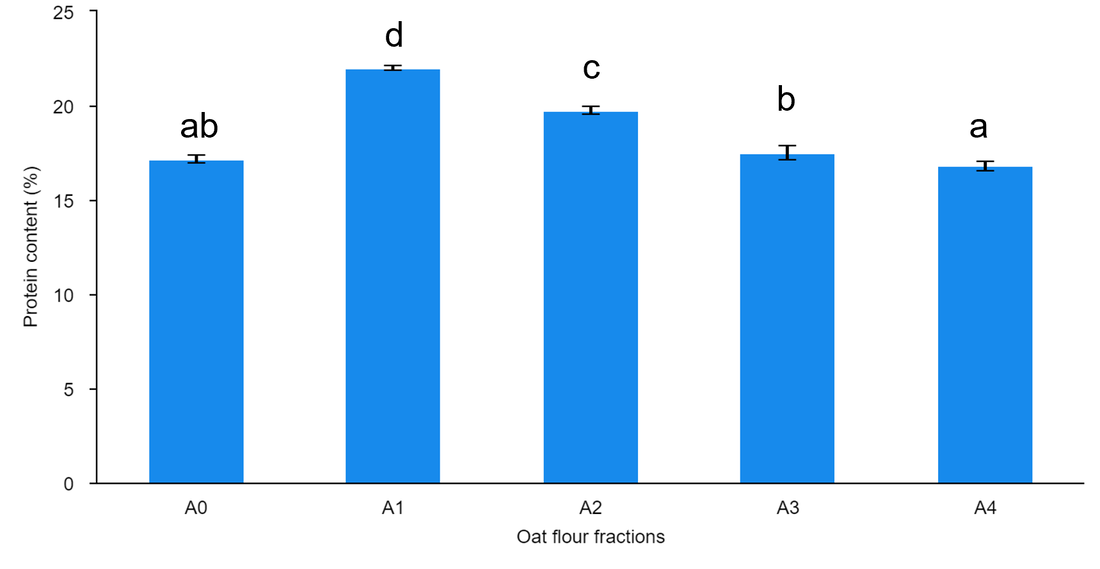
Graph 9. Bar chart of protein content (%) of different normal oat flour fractions by air classification. Lower case letters indicate significant differences among treatments. Treatments with the same letter are not significantly different at α = 0.05.
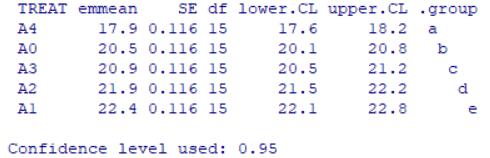
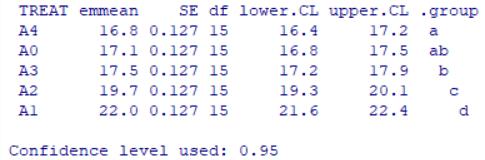
Graph 11. ANOVA on protein content (%) of different normal oat flour fractions by air classification.
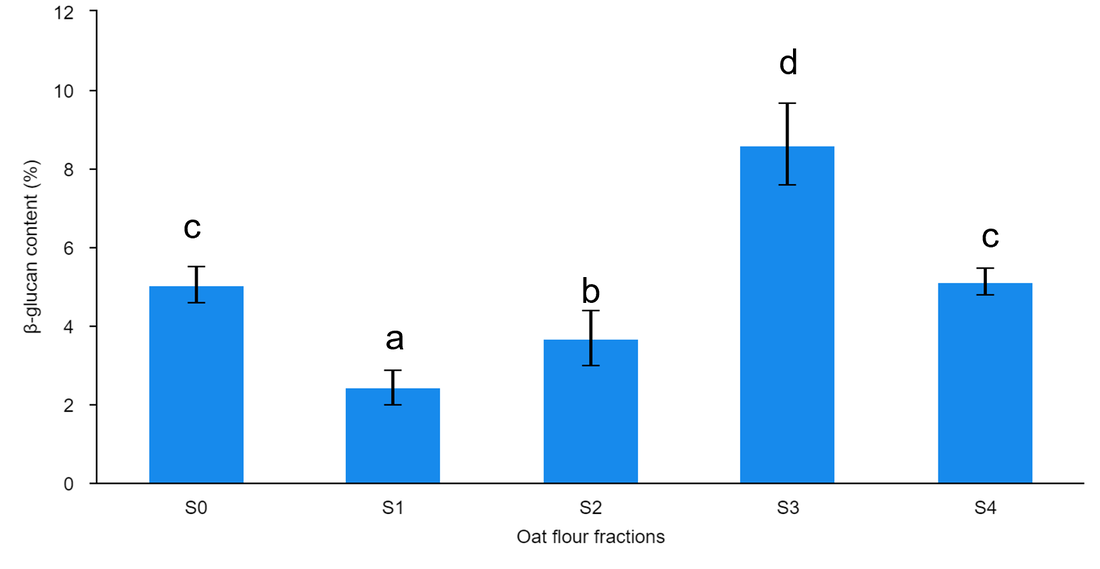
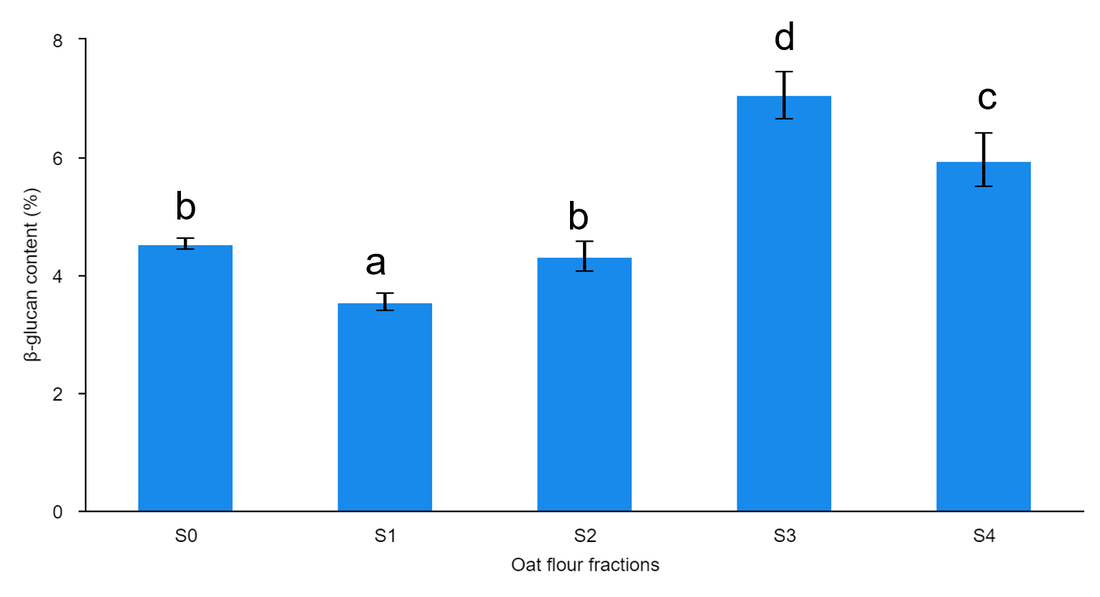
Graph 13. Bar chart of β-glucan content (%) of different normal oat flour sieving fractions. Lower case letters indicate significant differences among treatments. Treatments with the same letter are not significantly different at α = 0.05.
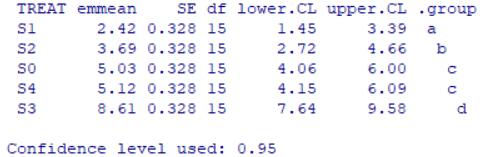
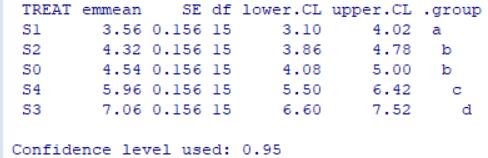
Graph 15. ANOVA on β-glucan content (%) of different normal oat flour sieving fractions.
|
Graph 6. Bar chart of protein content (%) of different gluten-free oat flour sieving fractions. Lower case letters indicate significant differences among treatments. Treatments with the same letter are not significantly different at α = 0.05.
Graph 8. ANOVA on protein content (%) of different gluten-free oat flour sieving fractions.
Graph 10. Bar chart of protein content (%) of different gluten-free oat flour fractions by air classification. Lower case letters indicate significant differences among treatments. Treatments with the same letter are not significantly different at α = 0.05.
Graph 12. ANOVA on protein content (%) of different gluten-free oat flour fractions by air classification.
Graph 14. Bar chart of β-glucan content (%) of different gluten-free oat flour sieving fractions. Lower case letters indicate significant differences among treatments. Treatments with the same letter are not significantly different at α = 0.05.
Graph 16. ANOVA on β-glucan content (%) of different gluten-free oat flour sieving fractions.
|
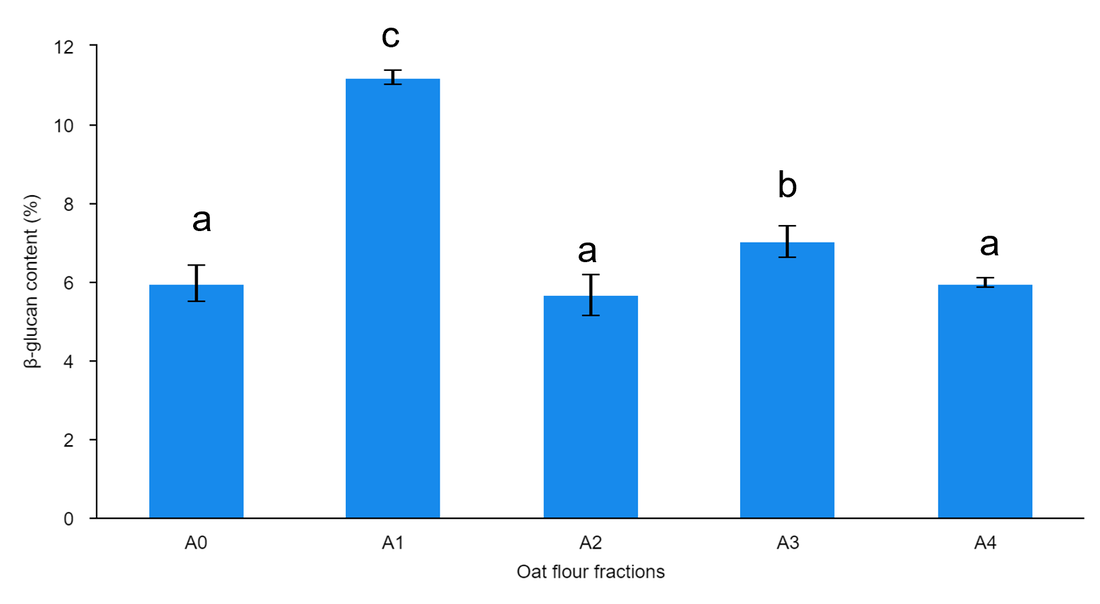
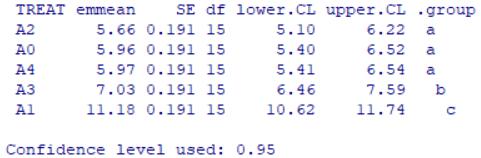
Graph 17. Bar chart of β-glucan content (%) of different normal oat flour fractions by air classification. Lower case letters indicate significant differences among treatments. Treatments with the same letter are not significantly different at α = 0.05.
Graph 19. Bar chart of β-glucan content (%) of different normal oat flour fractions by air classification.
|
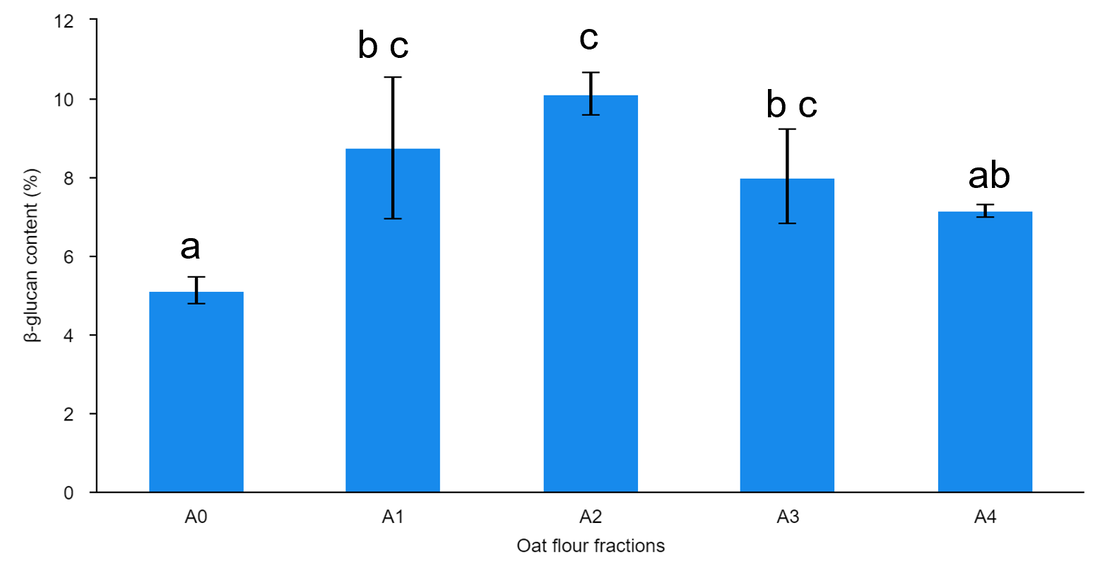
Graph 18. Bar chart of β-glucan content (%) of different gluten-free oat flour fractions by air classification. Lower case letters indicate significant differences among treatments. Treatments with the same letter are not significantly different at α = 0.05.
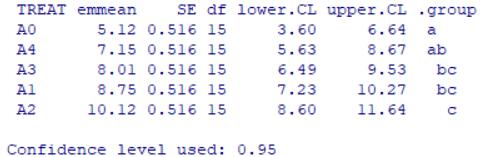
Graph 20. Bar chart of β-glucan content (%) of different gluten-free oat flour fractions by air classification.
|
In Graphs 5 and 6, we can see that the protein content of normal oat flour (18.4%) was higher than that of the gluten-free oat flour (16.3%) in the beginning (S0) due to different protein components. The protein content increased when the sieving size increased, which is the same as the research by Gu et al. (2022). This might be because the proteins distributed in the parts close to the superficial bran layer are higher than those distributed in the endosperm (Gu et al., 2022). Sieving had a significant effect on the can protein content of both oat cultivars’ flour. It significantly increased the protein content of both oat cultivars’ flour (S4). The best sieving size for protein content is 250 μm. The protein content of the normal oat flour increased by up to 20.5% and that of the gluten-free oat flour increased by up to 17.1%.
We can see that the protein content decreased when the air classification speed increased (Graphs 9 & 10). It was found that the air classification increased all the protein content except for the speed of 5500 of the gluten-free oat flour (A4). The protein content in A1 is significantly higher than that in A0 of both oat cultivars’ flour, so the best speed of air classification for protein content is 2500 rpm. The protein content of the normal oat flour increased up to 22.4% and that of the gluten-free oat flour increased up to 22.0%.
In Graphs 13 and 14, we can see that the β-glucan content of normal oat flour (5.08%) was higher than that of the gluten-free oat flour (4.54%) in the beginning (A0). Sieving can significantly influence the β-glucan content of both oat cultivars’ flour. The best sieving size for β-glucan content is 125 μm. Majid (2018) also found that the highest β-glucan content is in the fraction whose particle size is 150-250 μm. This might be because the β-glucan is not only distributed in oat bran but also in the endosperm, which is the biggest part of the oat grain. The β-glucan content of the normal oat flour increased by up to 8.6% and that of the β-glucan oat flour increased by up to 7.1%.
In Graphs 17 and 18, it was found that the air classification increased all the β-glucan content except for the speed of 3500 of the gluten-free oat flour (A2). The β-glucan content of normal oat flour in A2 is significantly higher than that in A0, the best speed of air classification of normal oat flour is 3500 rpm for β-glucan content. The β-glucan content of normal oat flour in A1 is significantly higher than that in A0, the best speed of air classification of normal oat flour is 2500 rpm for β-glucan content. The β-glucan content of the normal oat flour increased by up to 10.1% and that of the β-glucan oat flour increased by 11.2%.
Therefore, the 250 μm sieving size with the 3500 rpm speed of air classification is the best condition to produce β-glucan and protein-rich fraction for the normal gluten flour, while the 250 μm sieving size with the 2500 rpm speed of air classification is the best condition to produce β-glucan and protein-rich fraction for the gluten-free gluten flour.
Discussion
A normal oat flour fraction whose β-glucan content from 5.1% to 10.1% and protein content from 18.3% to 21.9% could be obtained, while a gluten-free oat flour fraction whose β-glucan content from 4.5% to 11.2% and protein content from 16.8% to 22.0% could be obtained. The sieving and air classification procedure is more effective to the gluten-free oat flour.
The speed of the classifying wheel and the size of the particle on the β-glucan and protein separation are both efficient. It is still possible to improve the fractionation process and thus simplify the use of β-glucan and protein in food products. Thus, in the near future, health-promoting products with increased β-glucan and protein content might appear on the market. This will make it possible to reach good intake levels without consuming large amounts of the product.
Also, this project showed that combining sieving and air classification is a good method used to enrich β-glucan and protein in oats. The ability to enrich β-glucan and protein levels could increase the economic value of oats. It might lead to the development of new products and be used in the food industry. There is potential for further optimization, but this will require some additional research.
